Fans and media seem to agree that there are at least two positives this season: Yakupov's improvement and the Oilers winning a little more under Todd Nelson. There is no doubt in my mind that Derek Roy taking Yakupov under his wing—through no encouragement from coaching or manager--has helped. If you watch games, you can see that Yakupov is visually better (hat-tip to Craig MacTavish). He enters the zone with more control, sometimes driving to the net if there’s a lane, or creating space to make a pass. Earlier in the season, and in past seasons, Yakupov's zone entries tended to be somewhat out of control with an occasional 1-on-4 mission-impossible entry. Many puck possessions were lost. But thanks to Roy's mentoring, and for a time, Benoit Pouliot's guidance, Yakupov has learned to think about where he should go and then use his speed, instead of rushing headlong into the zone and hope that it somehow works out.
I thought it would be useful to quantify what are eyes are telling us by looking at Yakupov’s metrics. First, I'll examine his metrics at even-strength (5v5) and then on the power-play (PP). Quantifying his improvement can help us identify if what we're seeing is truly improvement, or possibly just luck finally going his way. For instance, is the fact he's scoring more merely the statistical quirk known as regression to the mean (i.e., his bad puck-luck has finally turned around), or is he actually generating more shots on net?
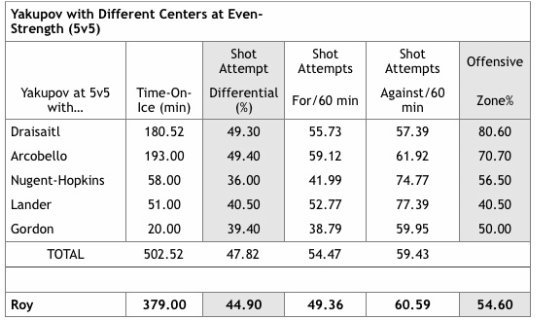
For each 5v5 metric, I'm going to compare Yakupov's numbers playing with Roy versus his previous centers.
Even-Strength (5x5) Possession Metrics
Here are some factors to consider, though, in Yakupov’s time with Roy. Looking at their zone starts, they are not getting cushy offensive zone-starts (54.5% offensive zone%). This is much less than Yakupov’s time with Draisaitl (80.5%) and Arcobello (70.7%). Also, with Hall out for an extended time with injury, Yakupov and Roy have essentially become cornerstones of the Oilers 2nd forward line. If I had to guess, their quality of competition is probably tougher than when Yakupov played the 3rd line minutes with Draisaitl and Arcobello. Moreover, the entire team’s 5v5 possession metrics have fallen since Nelson took over. This doesn’t necessarily implicate Nelson’s coaching system. During that time, the Oilers have lost David Perron and Jeff Petry (to trade), as well as Taylor Hall and Benoit Pouliot (to injury). Tough for the Oilers to maintain (or improve) their possession numbers when two of their best possession forwards—Hall and Perron—are not on the ice.
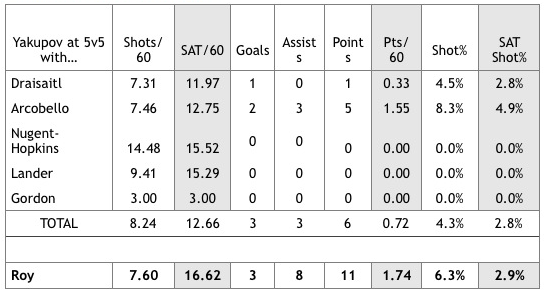
Still, using the “eye-test” and relative possession metrics, Yakupov’s defense is something he needs to work. At this point of his career, given his struggles, I’m all in favour of helping him building his confidence on offense. Yakupov has repeatedly stated he loves to score goals. Speaking of which, how is his 5v5 offense with Roy when compared to his previous centers? Let’s take a look.
Even-Strength (5x5) Production
This is all well and good. Yakupov is generating more shots and more frequently setting up teammates. When I looked at his shot attempt shooting percentage, though, I did have concerns. What we know about this figure, however, that you need about 3 seasons of data to have a reliable metric of ability. This season, with or without Roy, Yakupov’s shot attempt efficiency of 2.9% is below the league average among forwards of 4.2%. However, his 3-year career average is 4.8%. In other words, his puck luck is off this season, but in time, his shot efficiency should regress back to his “true” ability.
If Yakupov can maintain his shot and production level with Roy (presumably) next season, he should be able to put up 15-17 goals and 35-40 points. Now you may be thinking that this isn’t a lot of points, but keep in mind this is even-strength only. Forwards at this range include the likes of Scott Hartnell and Justin Williams.
Overall, at even-strength, Yakupov’s production is at respectable level with Roy, comparable to solid 2nd line forwards. Assuming 13 minutes/game at 5v5, his phenomenal shot attempt rate could help him produce 15-17 goals and 35-40 points over a full season. Although he has work to do on his two-way game, I think he needs to build his confidence on offense first to feel like he belongs in the NHL. Being mentored by Roy has helped his confidence tremendously.
Power-Play: Possession & Production Metrics
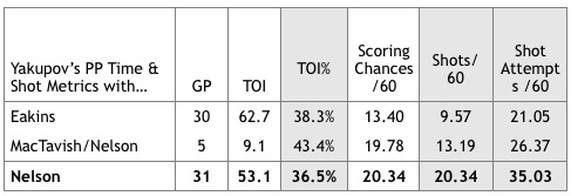
I examined Yakupov’s metrics on the power-play by comparing his numbers between coaches. I used coaches as a comparison for a few reasons. One, as I and other writers have noted, the Oilers’ power-play (and penalty kill) have improved under Nelson. Second, Yakupov sometimes plays the first-line PP with Nugent-Hopkins, but other times on the 2nd line with Roy. Simpler, and more logical then, to compare Yakupov’s performance between coaches then between centers. I had a few questions in mind in doing this analysis. Is Yakupov playing more PP under Nelson (as Eakins didn’t seem to trust Yakupov as much)? Similar to improved production at 5v5, has his PP output noticeably improved? Finally, when Yakupov is on the ice, is the Oilers’ PP unit still as potent as the 1st line unit? This table answers the first two questions.
- Unblocked rebounds and rush shots only in the low danger zone;
- All unblocked shots in the medium danger zone; &
- In the high danger zone, all shot attempts (assuming blocked shots taken here may be more representative of more “wide-open nets”).
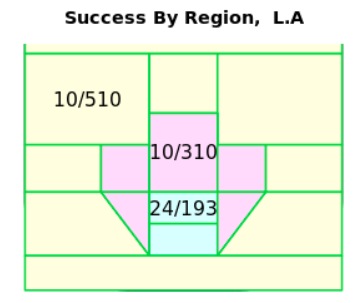
What are these different levels of danger zones? War-on-ice provides a useful diagram in which the yellow is “low,” light-purple is “medium,” and light-blue is the “high” danger zone. (The numbers are a partial season sample from Los Angeles.)
How about Yakupov’s scoring rate?
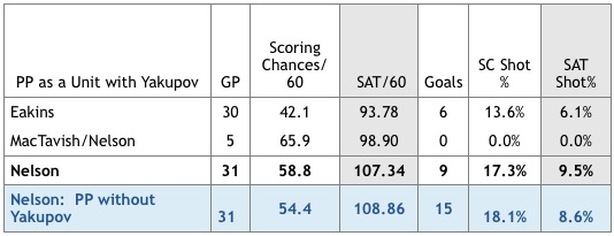
Above, I asked the question: When Yakupov is on the ice, is the Oilers’ PP unit still as potent as the 1st line unit? Here is how the PP performs with Yakupov (and compared between coaches).
The big question is: Are these numbers sustainable? Can Yakupov, and the Oilers as a team, keep producing and generating shots at this pace? After 31 games under Nelson, the PP has not slowed down. To watch it in motion, it is a thing of beauty. We see a well-oiled machine in which players the puck incredibly well, especially side-to-side, which inevitably opens a scoring lane for one-timers and/or open nets. And even more surprisingly, they have done it mostly without their top playmaker and most productive forward, Taylor Hall.
Summary
At even-strength, Yakupov continues to struggle on defense, but his offense has turned around. For that, we can thank Derek Roy, who has probably rescued Yakupov’s career. Playing with Roy, Yakupov’s shot attempt rate (16.62 SAT/60 min) ranks him among the top 35 to 40 forwards. His 1.74 points/60 minutes ranks him solidly among 2nd line forwards. Due to bad luck (i.e., statistical variance), his goal scoring is a bit low. Still, if can maintain these levels of shot generation and point production at even-strength next season, he could produce 35 to 40 points, with 15 to 17 goals. Under Coach Nelson’s power-play system, Yakupov’s offensive has also flourished. His shot attempt rate (35.03/60 min) places him among the top 25 to 30 forwards. Many of his shot attempts have been of higher quality. His scoring chance rate of 20.34/60 minutes ranks him among the top 15 to 20 forwards. If he continues to play 2nd line PP minutes next season, he should be able to produce about 15 points. Overall, Roy’s mentorship and Nelson’s PP system has reinvigorated Yakupov’s career. If Yakupov can maintain these shot generation and production numbers next season, he could reach realistically reach 50 to 55 points. For some, this may still seem low, but given his struggles over the last 3 years, for me, this kind of production would be a huge relief. At 21 years of age, Yakupov is still young. Forwards tend not to reach their prime until they are 24 years old, so he has time to improve even further.
Walter
Twitter: @Waltlaw69
Data courtesy of war-on-ice and stats.hockeyanalysis.
Notes: Instead of the term Corsi, I have used the descriptive term, shot attempts, which if you’re unfamiliar, includes blocked shots, missed shots, and shots on goal. Sometimes this makes for cumbersome wording. However, with the NHL now using shot attempts, and other descriptive terms, instead of the terms used in the analytics community, I’m going to try keep my blog posts consistent with the NHL’s terminology.

 RSS Feed
