I want to thank BeerLeagueHero for inviting me to write about hockey and statistics; one topic that I am fanatical about and the other leaves me awake at night until 3 A.M. I’ll let the reader figure out which descriptor fits with which topic. But to be honest, sometimes both descriptions fit both! Before I confuse everyone further, including myself, let me get back on track.
Since the spring, I have been toying with the idea of using advanced stats to help decide the more ambiguous NHL player awards; the Selke for best defensive forward and the Norris, for best defenseman.
Since the spring, I have been toying with the idea of using advanced stats to help decide the more ambiguous NHL player awards; the Selke for best defensive forward and the Norris, for best defenseman.
Corsi
I did not look up how these awards were defined, but I don’t think that matters too much. I am going with their intuitive meaning and provide a rationale for the kind of stats that can be used to identify the candidates for these awards. I won’t be choosing a winner, but rather, I’ll be presenting the top 6 candidates and their respective statistics and let the readers—with their hockey smarts, statistical acumen, and truculence—pick their winner. For this post, I will focus on the 2013/14 Selke candidates.
I’ll describe the process by which I chose the candidates. There are obvious candidates (for now) and those are the ones who have won in the past and currently nominated. So players like Kopitar (LAK) and P. Bergeron (BOS) came to mind. Because a center has the most defensive responsibility, including taking the majority of face offs (a statistic to factor in), I focused on centers. Mind you, I noted some impressive stats for wingers along the way, but eventually decided that comparing centers and wingers is like comparing apples to oranges when it comes to defense. Perhaps there should be separate award for best defensive winger? A question for another day.
The first statistic I looked at was not their offensive production, or +/-, but their overall possession metric: Corsi differential (Corsi-For Percent; or CF %). Offensive production is also useful to include. I think it’s reasonable to assume that you would like even a defensive forward to be productive; balance and depth and all that. I did not factor in +/- because the sample size is too small in a single season. In fact, it takes about 3 seasons of data to arrive at a statistically significant +/-. That is to say, there is more randomness (“luck”) involved in goals for and against than non-statistical fan realizes. In short, +/- is statistically unreliable, and thus invalid, over a single season.
For those new to advanced hockey statistics, Corsi is the name given to shot attempts in 5-on-5 situations, which is composed of shots on net, blocked shots, and shots missing the net. Corsi, or shot attempts, is used as a broad metric to assess possession. The logic is if you shoot the puck at the net more than the opposing team, you tend to possess the puck more. Technically, then, it’s not really a measure of defense, but a measure of puck control. You can look at it this way, though: If you control the puck more, that’s less time the opponent has the puck. A good defense includes having a strong puck-controlling offense.
The CF% metric is calculated using the formula 100 x CF / (CF + CA), where CF = Corsi-For and CA = Corsi-Against. This metric gives a percentage that estimates whether the team has more or fewer shot attempts while the player in question is on the ice. Having a CF% of over 50% is an index of positive possession and under 50% indicates negative possession. To be clear, the number reflects all 5 players on the ice, not just the individual. As such, it’s a very broad and rough statistic, but it’s a starter. You have start somewhere, right?
By first looking at CF% among centers, I identified about 8-10 potential candidates. Each had a strong CF%, but what about teams who are strong in possession? (Here I am thinking about a team like New Jersey, who is a super-strong possession team and every player has a high CF%.) So how do we isolate individual performance from team performance?
Corsi: Relative & WOWY
One metric that can be used as a broad measure of individual possession is Relative Corsi (Rel-Corsi %). This measures the difference in shot attempts while the player is on the ice versus off the ice. If the relative Corsi is positive, then we can assume that this player is actually helping his team get more shot attempts. If the relative Corsi is negative, then this suggests this player is hurting his team’s puck possession. Even if an entire team has strong possession metrics and a player still has a positive Rel-Corsi %, then this suggests that the individual’s contribution to possession is over and above team effects. But is the Relative Corsi measure enough to isolate the player’s individual contribution?
We can take this a step further and examine the player’s With-or-Without-You (WOWY) Corsi. In a sense, this a breakdown of the Relative Corsi into its component player combinations. Perhaps there are few teammates who really help boost the player’s Corsi, whereas with most other teammates, being paired with the player drags down their Corsi. In this situation, the player in question is not driving possession, but is a passenger. He looks good because of other, stronger teammates carrying him (e.g., Kunitz reached career highs in his 30s because he plays with Crosby, not because he has somehow improved on his own). The detailed WOWY Corsi would be too much to include, but I can summarize by indicating the number of teammates the candidate helps (i.e., + X) and the number he hurts (i.e., - Y).
We can take this a step further and examine the player’s With-or-Without-You (WOWY) Corsi. In a sense, this a breakdown of the Relative Corsi into its component player combinations. Perhaps there are few teammates who really help boost the player’s Corsi, whereas with most other teammates, being paired with the player drags down their Corsi. In this situation, the player in question is not driving possession, but is a passenger. He looks good because of other, stronger teammates carrying him (e.g., Kunitz reached career highs in his 30s because he plays with Crosby, not because he has somehow improved on his own). The detailed WOWY Corsi would be too much to include, but I can summarize by indicating the number of teammates the candidate helps (i.e., + X) and the number he hurts (i.e., - Y).
Measuring Defense with Corsi-Against?
At this point, we have Corsi-For %, Relative Corsi %, and WOWY Corsi. Along the way, I asked myself, “Why not use Corsi-Against as a defensive metric?” I suppose it can be included, but each team has different standards for shots for and against. For example, New Jersey has a style of play that really limits shots for and against. Any NJ player will have an exceptional Corsi-Against. As far as I can tell, there is no computed Relative Corsi-Against (I’m sure it can be calculated, but that would take more work than I wish to commit.) Also, would this contribute anything substantive in addition to the CF% metric? I’m guessing here, but I suspect not. Yet, if someone wants to do the calculations and tell me I’m missing out on something important by excluding CA, by all means. I’m not a statistical dogmatist. I welcome disagreement, especially when it’s explained to me with evidence and logic.
Quality of Competition
What about Quality of Competition? After all, if a particular player is able to put up possession numbers similar to other candidates, yet is able to do this against harder competition, would this not be an important factor to consider? I used to have a handy website for this measure — extraskater.com — but the site’s creator, Mr. Metcalf, was hired by the Toronto Maple Leafs and the site has been subsequently closed. Thus, I had to do some digging. What I found is a bit complicated. The owner of stats.hockeyanalysis.com has computed indices that include Corsi and Quality of Competition.
I wish I could tell you how he came up with these numbers, but I was unable to decipher his method. Suffice to say, I will rank the players on this index in which 1 = the strongest opposition and 6 = the weakest. The index is called Hockey Analysis Rating Total (Offense & Defense) – Quality of Competition (HART QOC). That’s a mouthful and then some.
I wish I could tell you how he came up with these numbers, but I was unable to decipher his method. Suffice to say, I will rank the players on this index in which 1 = the strongest opposition and 6 = the weakest. The index is called Hockey Analysis Rating Total (Offense & Defense) – Quality of Competition (HART QOC). That’s a mouthful and then some.
Zone Starts
What about zone starts? I am going to assume possession is more difficult when more zone starts occur more often in the defensive zone. When a player loses a face-off in the d-zone, this can easily lead to a shot attempt against. If that same player loses a face-off in the offensive zone, a shot attempt is a lot less likely. So to account for this factor, I’m including defensive zone face-off percentage (DZFO%). Finally, I’ll add two more traditional statistics: Offensive production (Goals & Assists) and face-off percentage (FO%).
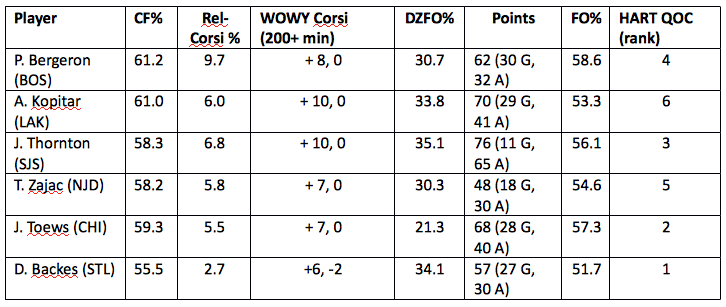
Here is a summary of the stats: Corsi-For differential (CF %), Relative Corsi (Rel-Corsi %), WOWY(with or without you) Corsi, DZFO% (defensive zone faceoff), Points, & Face-Offs (FO %)
Fancy Stat Best Defensive Forward Trophy Nominees
For your consideration, below are the top 6 “fancy stat” candidates for the Selke award. I list their respective statistics and ask the reader—after carefully considering the numbers--who are their top 3. Then based on this vote, we will select the Fancy Stat “Selke” Award winner. Perhaps we will have to call the award something else to avoid getting into trouble with NHL. For now, I’ll go with Best Defensive Forward – Fancy Stats. If you have a creative suggestion for the award name, I’m all ears.
| | | |
Some Final Notes
What’s interesting to me is that 2 of the candidates—Thornton and Zajac—were not given a single vote by any in the Professional Hockey Writers' Association. Using these statistics, Thornton’s numbers were very comparable to the actual 3 candidates (Kopitar, Bergeron, & Toews). Notably, Thornton had the most d-zone starts of all the candidates and tougher competition than either Bergeron or Kopitar.
Hope you enjoyed my first blog post here. Please vote!
Hope you enjoyed my first blog post here. Please vote!
 RSS Feed
